Baselining vs. Highpass filtering
Here we compare the evokeds when we baseline it vs. highpass filter it.
import os
import os.path as op
import sys

import matplotlib.pyplot as plt

import mne
from mne import Epochs

sys.path.append(op.join('..', '..', 'processing'))
from library.config import (study_path, meg_dir, tmin, tmax, l_freq,
                            set_matplotlib_defaults,
                            annot_kwargs)  # noqa: E402

subject = "sub003"
event_ids = [5, 6, 7]  # Famous faces
filter_params = dict(fir_window='hamming', phase='zero',
                     h_trans_bandwidth='auto', filter_length='auto',
                     fir_design='firwin')
Read in raw data and prepare for epoching
raw_fname = op.join(study_path, 'ds117', subject, 'MEG', 'run_01_sss.fif')
raw = mne.io.read_raw_fif(raw_fname, preload=True, verbose='error')

events = mne.find_events(raw, stim_channel='STI101', consecutive='increasing',
                         mask=4352, mask_type='not_and', min_duration=0.003,
                         verbose=True)
Out:
147 events found
Events id: [ 5  6  7 13 14 15 17 18 19]
Load our ICA.
ica = mne.preprocessing.read_ica(op.join(meg_dir, subject,
                                         'run_concat_highpass-%sHz-ica.fif'
                                         % (l_freq,)))
Out:
Reading /tsi/doctorants/data_gramfort/dgw_faces_reproduce/MEG/sub003/run_concat_highpass-NoneHz-ica.fif ...
Now restoring ICA solution ...
Ready.
Just some config for plotting
set_matplotlib_defaults()

ylim = dict(mag=(-400, 400))
times = [0, 0.12, 0.4, tmax-0.1]

if not op.isdir('figures'):
    os.mkdir('figures')


def adjust_fig(fig, label, title, include_cbar=False):
    fig.set_size_inches(2.0, 2.0, forward=True)
    plt.subplots_adjust(left=.18, right=.99, bottom=.18,
                        top=1.2)
    fig.delaxes(fig.axes[1])
    for ax in fig.axes[1:-1]:
        ax.set(xticks=[0])
        ax.set(xticklabels=[ax.get_title().split()[0]], title='')
        ax.tick_params(length=0)
    fig.axes[-1].set_position([0.1, 0.73, 0.025, 0.2])
    if not include_cbar:
        fig.delaxes(fig.axes[-1])
    fig.axes[0].get_yaxis().set_label_coords(-0.15, 0.5)
    for li in range(len(times)):
        fig.lines[li] = mne.viz.evoked._connection_line(
            times[li] * 1000, fig, fig.axes[0], fig.axes[li + 1])
    fig.axes[0].annotate(label, (-0.135, 1.35), **annot_kwargs)
    fig.axes[2].set(title=title)
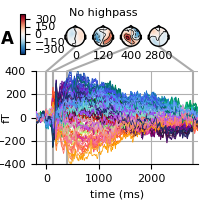
First, we don’t highpass filter and only baseline correct.
plt.rcParams['axes.titlesize'] = 8
plt.rcParams['lines.linewidth'] = 0.5
kwargs = dict(
    times=times, title=None, ts_args=dict(ylim=ylim, spatial_colors=True),
    topomap_args=dict(vmin=-400, vmax=400, sensors=False, outlines='head'))
raw.filter(None, 40, **filter_params)
evoked = Epochs(raw, events, event_id=event_ids,
                tmin=tmin, tmax=tmax, baseline=(None, 0)).average()
ica.apply(evoked)
evoked.pick_types(meg='mag')
fig = evoked.plot_joint(**kwargs)
adjust_fig(fig, 'A', 'No highpass', include_cbar=True)
fig.savefig(op.join('..', 'figures', 'FanningA.pdf'), bbox_to_inches='tight')
Out:
48 matching events found
0 projection items activated
Transforming to ICA space (66 components)
Zeroing out 4 ICA components
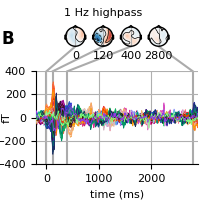
Next, we highpass filter (but no lowpass filter as we have already done it) but don’t baseline. Now, the late effects in the topography are no longer visible (see above).
raw.filter(1, None, l_trans_bandwidth=0.5, **filter_params)
evoked = Epochs(raw, events, event_id=event_ids,
                tmin=tmin, tmax=tmax, baseline=None).average()
ica.apply(evoked)
evoked.pick_types(meg='mag')
fig = evoked.plot_joint(**kwargs)
adjust_fig(fig, 'B', '1 Hz highpass')
fig.savefig(op.join('..', 'figures', 'FanningB.pdf'), bbox_to_inches='tight')
Out:
48 matching events found
0 projection items activated
Transforming to ICA space (66 components)
Zeroing out 4 ICA components
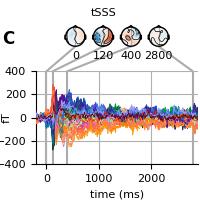
Finally, we can also use the tSSS data which has a highpass filtering effect and the “fanning” will not be visible also in this case. See 03. Maxwell filter using MNE-python.
raw_fname = op.join(meg_dir, subject, 'run_01_filt_tsss_1_raw.fif')
raw = mne.io.read_raw_fif(raw_fname, preload=True)
evoked = Epochs(raw, events, event_id=event_ids,
                tmin=tmin, tmax=tmax, baseline=(None, 0)).average()
ica.apply(evoked)
evoked.pick_types(meg='mag')
fig = evoked.plot_joint(**kwargs)
adjust_fig(fig, 'C', 'tSSS')
fig.savefig(op.join('..', 'figures', 'FanningC.pdf'), bbox_to_inches='tight')
Out:
Opening raw data file /tsi/doctorants/data_gramfort/dgw_faces_reproduce/MEG/sub003/run_01_filt_tsss_1_raw.fif...
    Range : 222200 ... 765599 =    202.000 ...   695.999 secs
Ready.
Current compensation grade : 0
Reading 0 ... 543399  =      0.000 ...   493.999 secs...
48 matching events found
0 projection items activated
Transforming to ICA space (66 components)
Zeroing out 4 ICA components
Total running time of the script: ( 1 minutes 2.616 seconds)