Remove ECG and EOG using ICA
Remove physiological artifacts for sub005 using ICA.
import os
import os.path as op
import sys

import mne
from mne.preprocessing import create_ecg_epochs, create_eog_epochs, read_ica

sys.path.append(op.join('..', '..', 'processing'))
from library.config import (meg_dir, map_subjects, l_freq,
                            set_matplotlib_defaults)  # noqa: E402

set_matplotlib_defaults()
subject_id, run = 3, 1
subject = "sub%03d" % subject_id
print("processing subject: %s" % subject)

data_path = op.join(meg_dir, subject)
Out:
processing subject: sub003
Now we get the bad channels.
mapping = map_subjects[subject_id]  # map to correct subject
all_bads = list()

bads = list()
bad_name = op.join('bads', mapping, 'run_%02d_raw_tr.fif_bad' % run)
if os.path.exists(bad_name):
    with open(bad_name) as f:
        for line in f:
            bads.append(line.strip())
We read the data.
run_fname = op.join(data_path, 'run_%02d_filt_sss_highpass-%sHz_raw.fif'
                    % (run, l_freq))
raw = mne.io.read_raw_fif(run_fname, preload=True)
Out:
Opening raw data file /tsi/doctorants/data_gramfort/dgw_faces_reproduce/MEG/sub003/run_01_filt_sss_highpass-NoneHz_raw.fif...
    Range : 222200 ... 765599 =    202.000 ...   695.999 secs
Ready.
Current compensation grade : 0
Reading 0 ... 543399  =      0.000 ...   493.999 secs...
Bad sensors are repaired.
raw.info['bads'] = bads
raw.interpolate_bads()
raw.set_eeg_reference(projection=True)
Out:
Computing interpolation matrix from 70 sensor positions
Interpolating 0 sensors
Adding average EEG reference projection.
1 projection items deactivated
Average reference projection was added, but has not been applied yet. Use the apply_proj method to apply it.
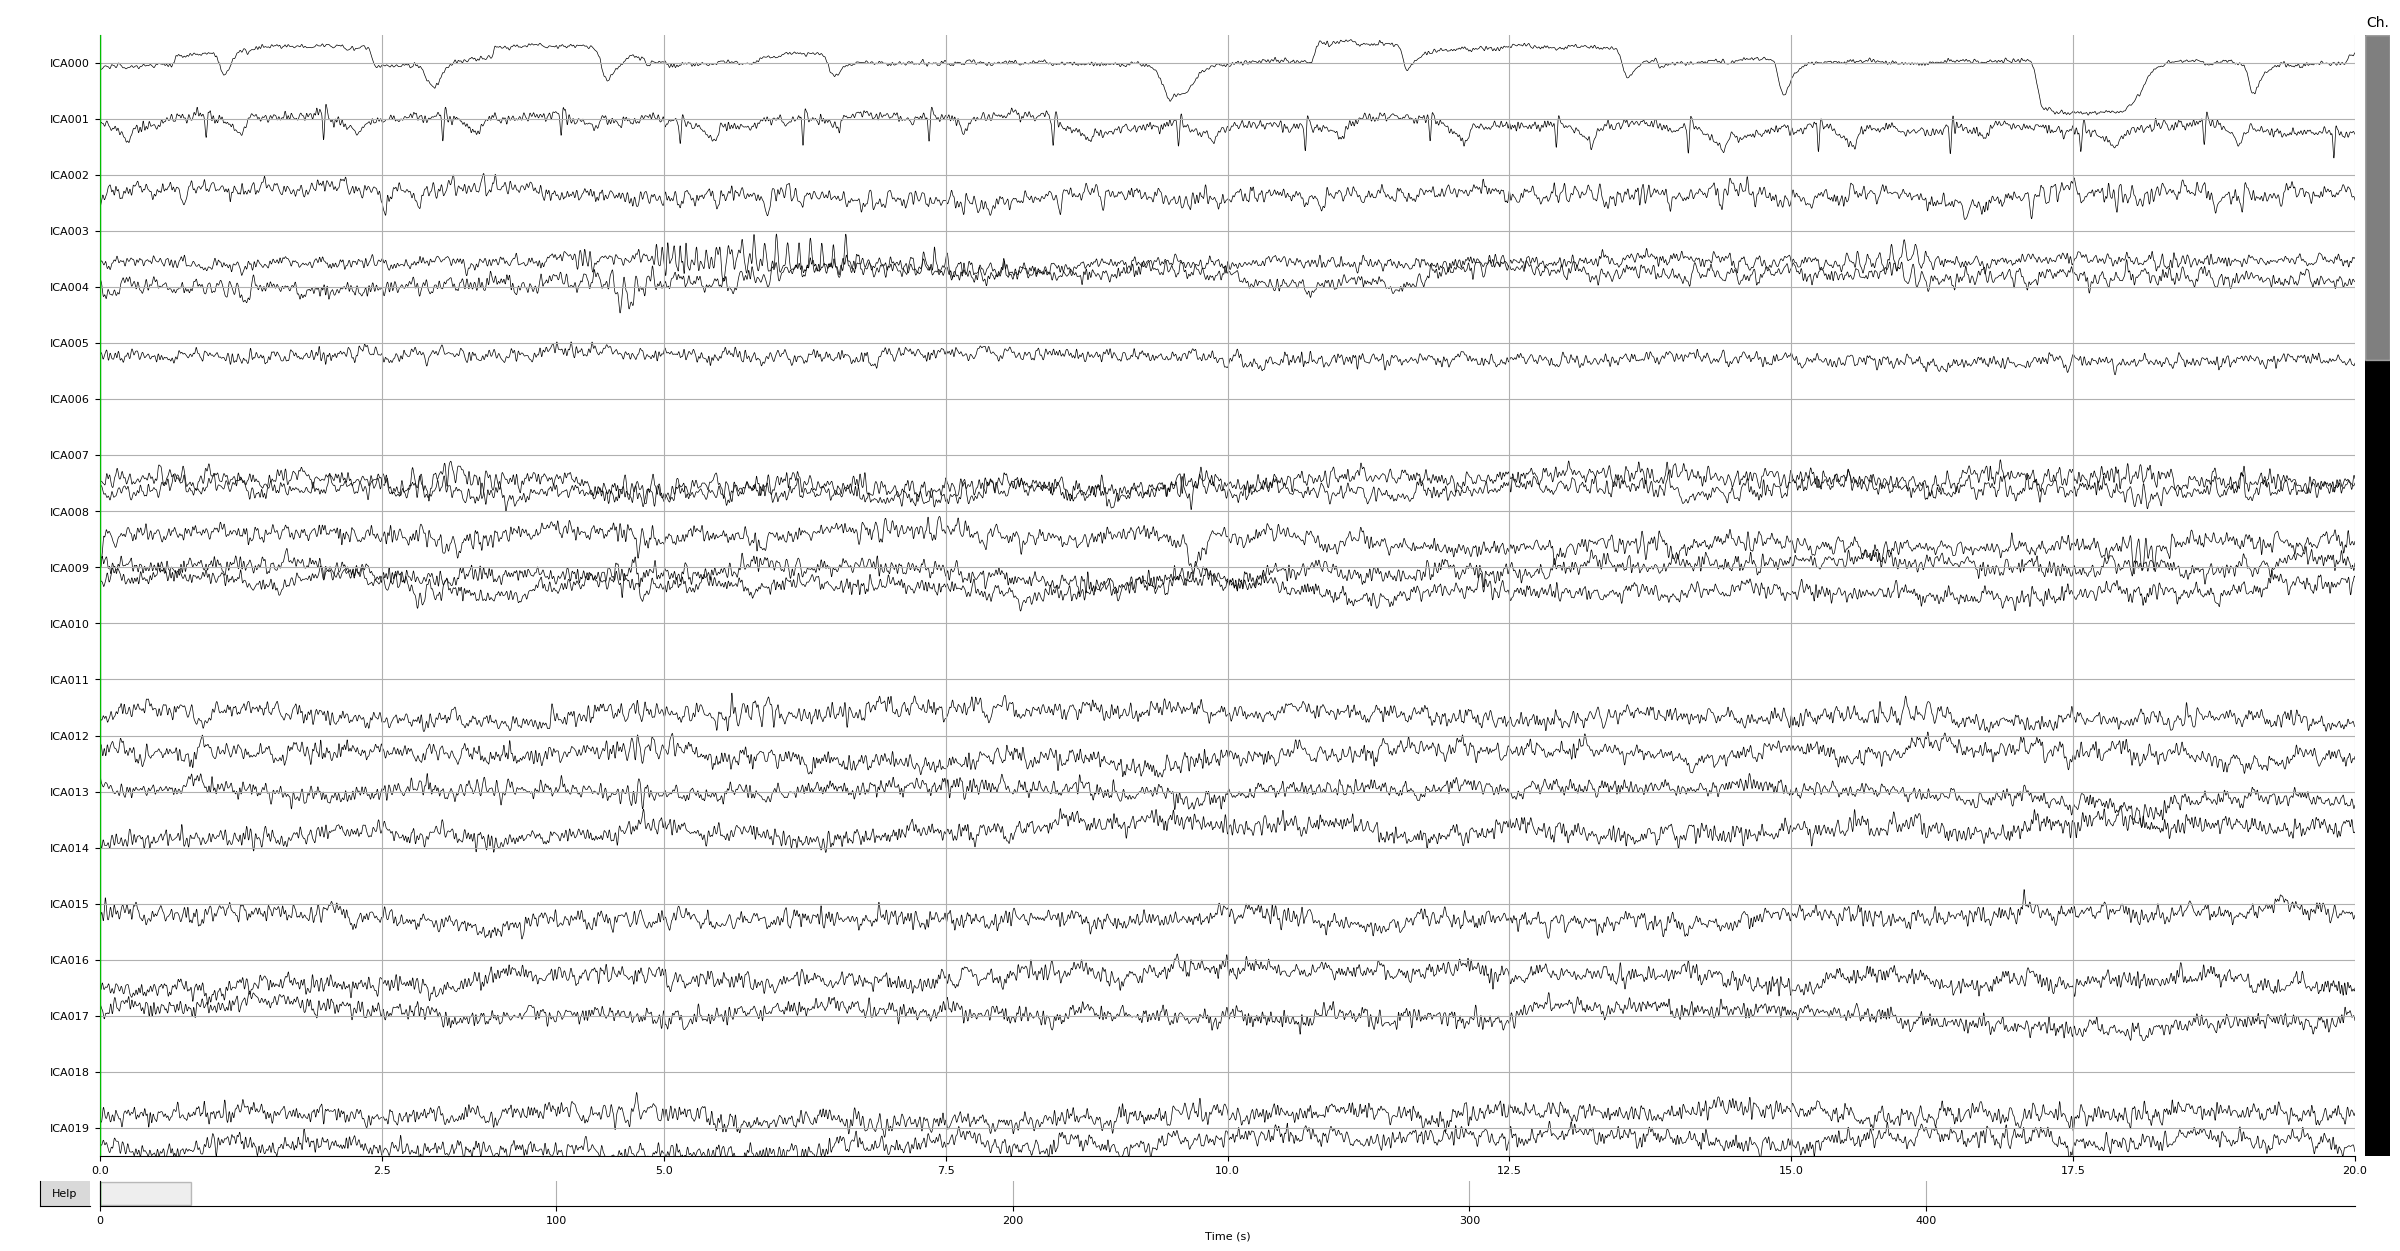
Now let’s get to ICA preprocessing. Let’s look at our ICA sources on raw:
ica_name = op.join(meg_dir, subject, 'run_concat_highpass-%sHz-ica.fif'
                   % (l_freq,))
ica = read_ica(ica_name)
ica.exclude = []
ica.plot_sources(raw)
Out:
Reading /tsi/doctorants/data_gramfort/dgw_faces_reproduce/MEG/sub003/run_concat_highpass-NoneHz-ica.fif ...
Now restoring ICA solution ...
Ready.
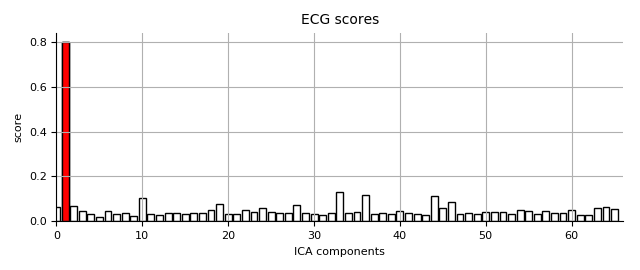
Now let’s find ECG events and score ICA components:
n_max_ecg = 3  # use max 3 components
ecg_epochs = create_ecg_epochs(raw, tmin=-.3, tmax=.3)
ecg_epochs.decimate(5).apply_baseline((None, None))
ecg_inds, scores_ecg = ica.find_bads_ecg(ecg_epochs, method='ctps')
print('Found %d ECG component(s)' % (len(ecg_inds),))
ica.exclude += ecg_inds[:n_max_ecg]
ica.plot_scores(scores_ecg, exclude=ecg_inds, title='ECG scores')
Out:
Using channel ECG063 to identify heart beats.
Setting up band-pass filter from 8 - 16 Hz
Filter length of 16384 samples (14.895 sec) selected
Number of ECG events detected : 439 (average pulse 53 / min.)
439 matching events found
Created an SSP operator (subspace dimension = 1)
Loading data for 439 events and 661 original time points ...
0 bad epochs dropped
Applying baseline correction (mode: mean)
Found 1 ECG component(s)
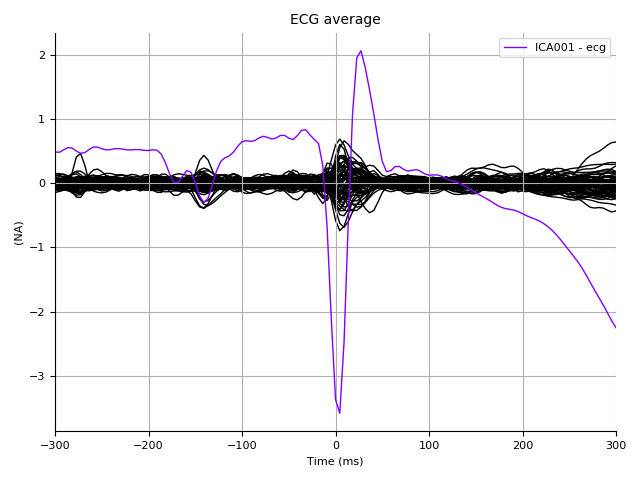
Let’s look at how these sources impact the ECG epochs:
ica.plot_sources(ecg_epochs.average(), title='ECG average')
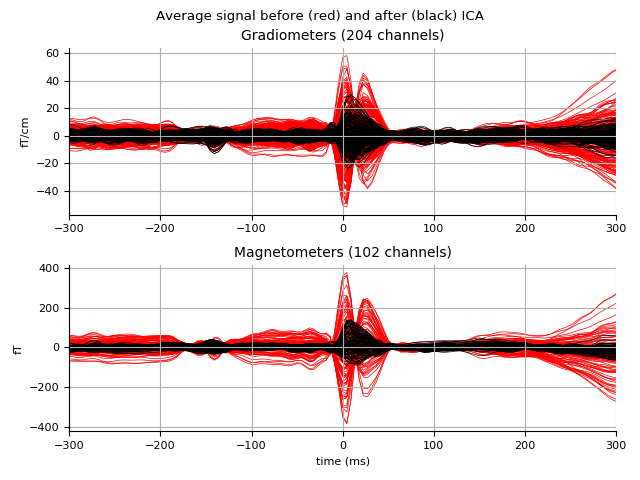
Then look at what gets removed:
ica.plot_overlay(ecg_epochs.average())
Out:
Transforming to ICA space (66 components)
Zeroing out 1 ICA components
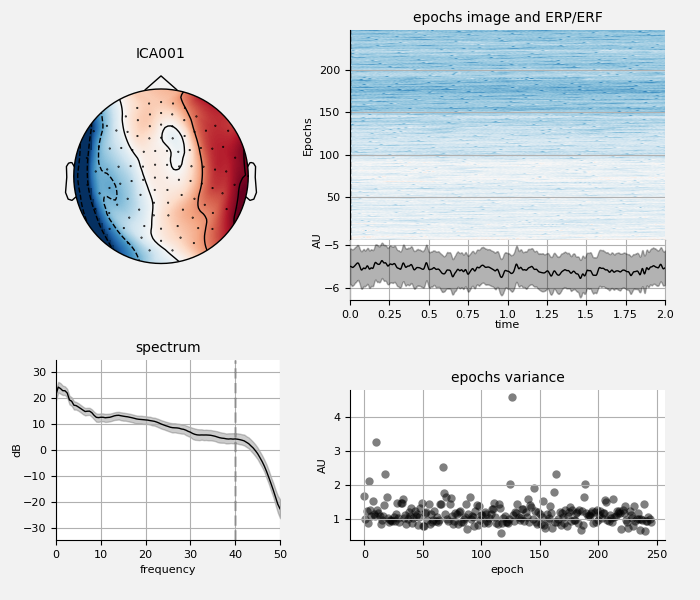
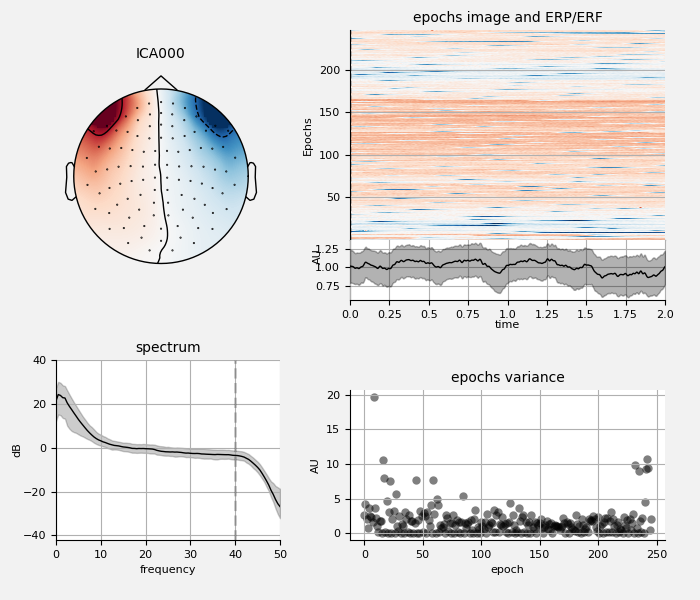
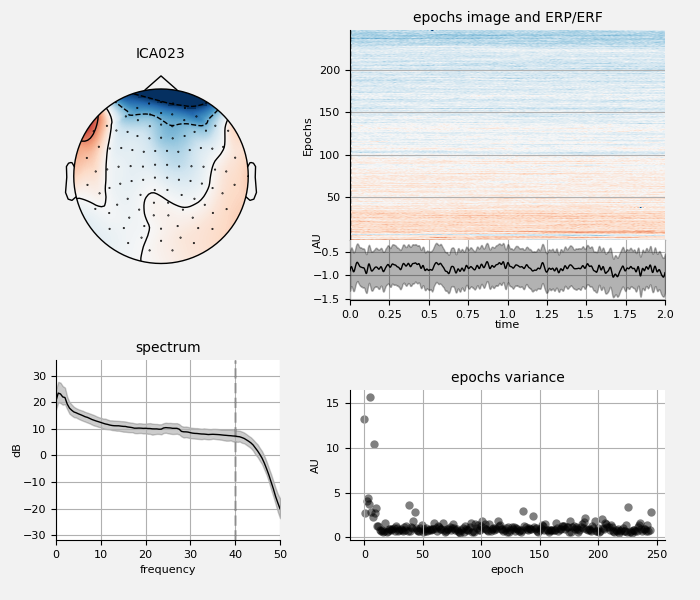
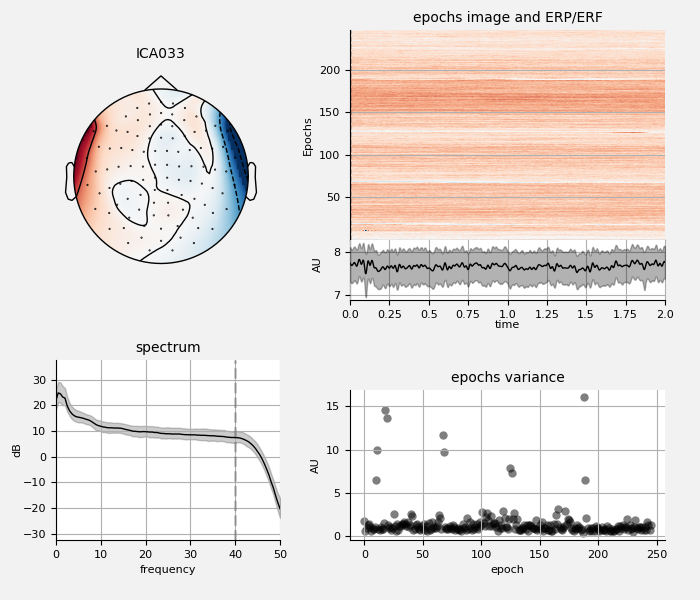
We can also examine the properties of these ECG sources:
ica.plot_properties(raw, ecg_inds[:n_max_ecg])
Now do the same for EOG:
n_max_eog = 3 # use max 3 components
eog_epochs = create_eog_epochs(raw, tmin=-.5, tmax=.5)
eog_epochs.decimate(5).apply_baseline((None, None))
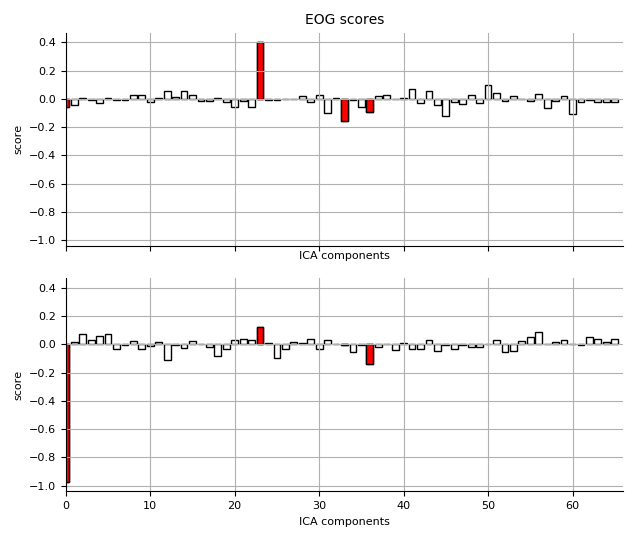
eog_inds, scores_eog = ica.find_bads_eog(eog_epochs)
print('Found %d EOG component(s)' % (len(eog_inds),))
ica.exclude += eog_inds[:n_max_eog]
ica.plot_scores(scores_eog, exclude=eog_inds, title='EOG scores')
Out:
EOG channel index for this subject is: [366 367]
Filtering the data to remove DC offset to help distinguish blinks from saccades
Setting up band-pass filter from 2 - 45 Hz
Filter length of 16384 samples (14.895 sec) selected
Setting up band-pass filter from 2 - 45 Hz
Filter length of 16384 samples (14.895 sec) selected
Setting up band-pass filter from 1 - 10 Hz
Filter length of 16384 samples (14.895 sec) selected
Now detecting blinks and generating corresponding events
Number of EOG events detected : 198
198 matching events found
Created an SSP operator (subspace dimension = 1)
Loading data for 198 events and 1101 original time points ...
0 bad epochs dropped
Applying baseline correction (mode: mean)
Found 4 EOG component(s)
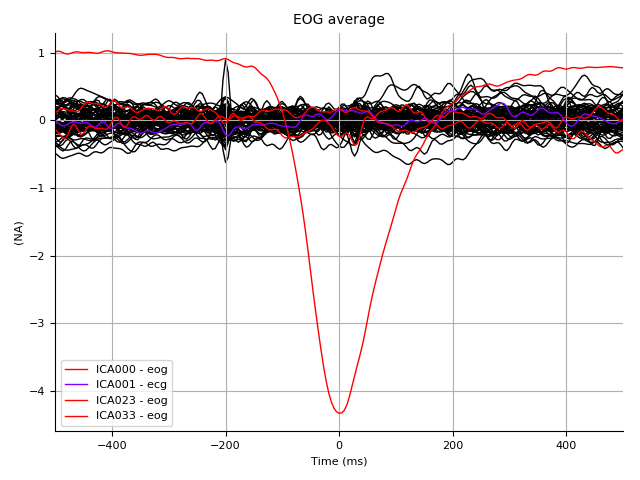
Again look at the impact of these sources on the EOG epochs:
ica.plot_sources(eog_epochs.average(), title='EOG average')
Look at what gets removed:
ica.plot_overlay(eog_epochs.average())
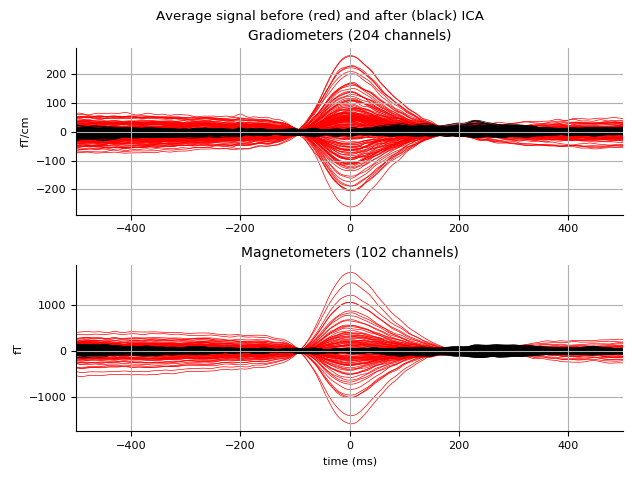
Out:
Transforming to ICA space (66 components)
Zeroing out 4 ICA components
Look at the properties of these EOG sources:
ica.plot_properties(raw, eog_inds[:n_max_eog])
Total running time of the script: ( 1 minutes 25.284 seconds)